Well, it has been a week since we launched our new website and started working with our own Inbound marketing strategy. Seconds after hitting the publish button we celebrated by drinking way too much champagne. Now, celebration time is over and It’s time to “wake up and smell the coffee", meaning taking a close look at some results.
Celebrating the launch of a new chapter! https://t.co/0jFsTlzt11 #agencylife #inboundmarketing ping @shonaghhurley 😃 pic.twitter.com/S6r1iucz9z
— iGoMoon (@iGoMoon) February 12, 2016
Evaluate and optimise for success
Just like New York, the digital world never sleeps. Building a website is a never-ending process. You need to evaluate your performances all the time and optimize there after. Otherwise you will likely fail.
Benchmark - how to's
In order to evaluate iGoMoon:s website compared this weeks data with the same week last year (2015). If you don’t have data from previous years you can use Industry-benchmarks or start your evaluating process after a couple of weeks and compare the new data to them.
Traffic results so far - Google Analytics
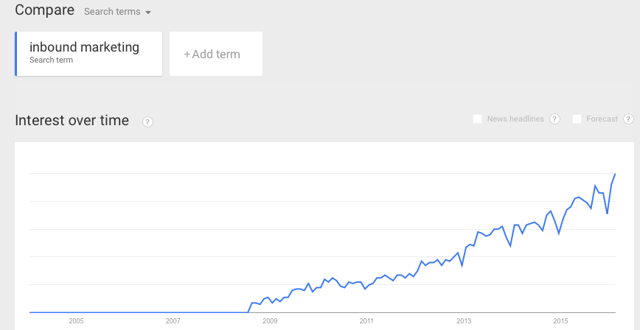
Inbound marketing is currently one of the biggest marketing trends (see google trend search). Looking at inbound marketing's increased popularity combined with our newly redesigned website - it's not a surprise that we have 3 times more visitors this week compared to last year (users).

Visistors are consuming more content
Our new website has received a makeover with new and improved content and our readers seem to like it! The new data shows that our visitors are reading one more page extra and spend an extra minute on our site than last year.
Involve the team to get more reach
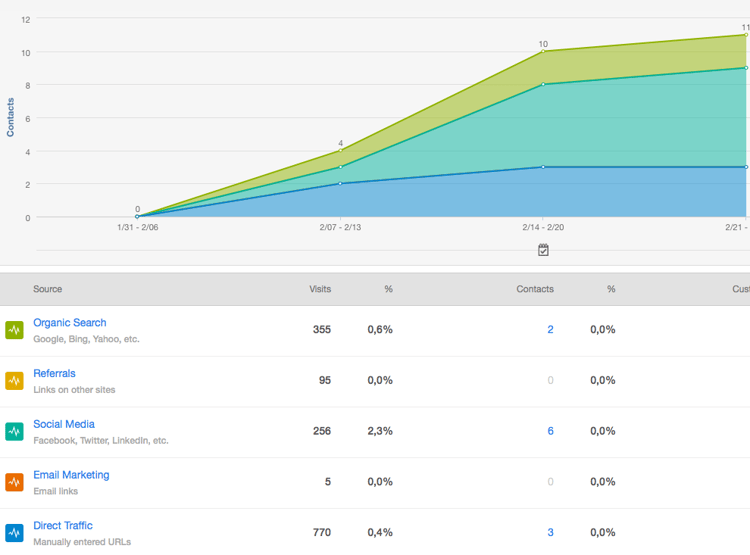
My co-workers and I promoted our website in different social media channels such as Facebook and LinkedIn and therefore social media generated most traffic to our website last week. Many companies forget to involve their own employees and their personal networks in the marketing process. That's a pity, because by involving the company-staff one can really increase the company's reach in social media.
2015
2016

11 new leads week one
During our launching week we gained 11 new leads. 6 of these leads came from social media. Social media was the source that generated most leads. It feels great that our social media initiatives work so well when it comes to our Inbound marketing strategy. The conversion-rate was 0,7% last week. That result was a little bit to low for us and i'll think we'll increase it this week.

Do you want to learn more?
Read the text below where i describe the differences between the KPI:s that i menationed earlier.
What is the difference between the KPI:S (key performance indicator) users and sessions? The difference is that a user only is counted once during the time range. It means that a user can make many sessions.
Avg. sessions duration/avg. pages per session
Why are these KPI:s important? Well, the combination of the KPI:s avg. session duration and pages/session will tell you if your web visitors are interested in your content and that you have good website structure. If your visitors stay on you website for a long time and read several pages it indicates that they actually find your content interesting and relevant. If your visitors read several pages on your site in a short time it indicates that your audience can’t find what they are looking for and that you need to see over your website structure.
Bounce rate
Bounce rate shows the percentage of visitors that choose to exit the website after only visiting one page. This, however, doesn’t mean that the visitor had not interest in the content on that exact page. It’s natural that some pages will have a high bounce rate. For example, contact pages, news pages and blogs are typically pages that normally have a little higher bounce rate than rest of the pages on the website.
What do you think about our first week?
Please leave a comment, or are you looking for more website redesign tips? Check out our guide!